Looker Studio SEO Dashboard: Build an SEO Report Leaders Read
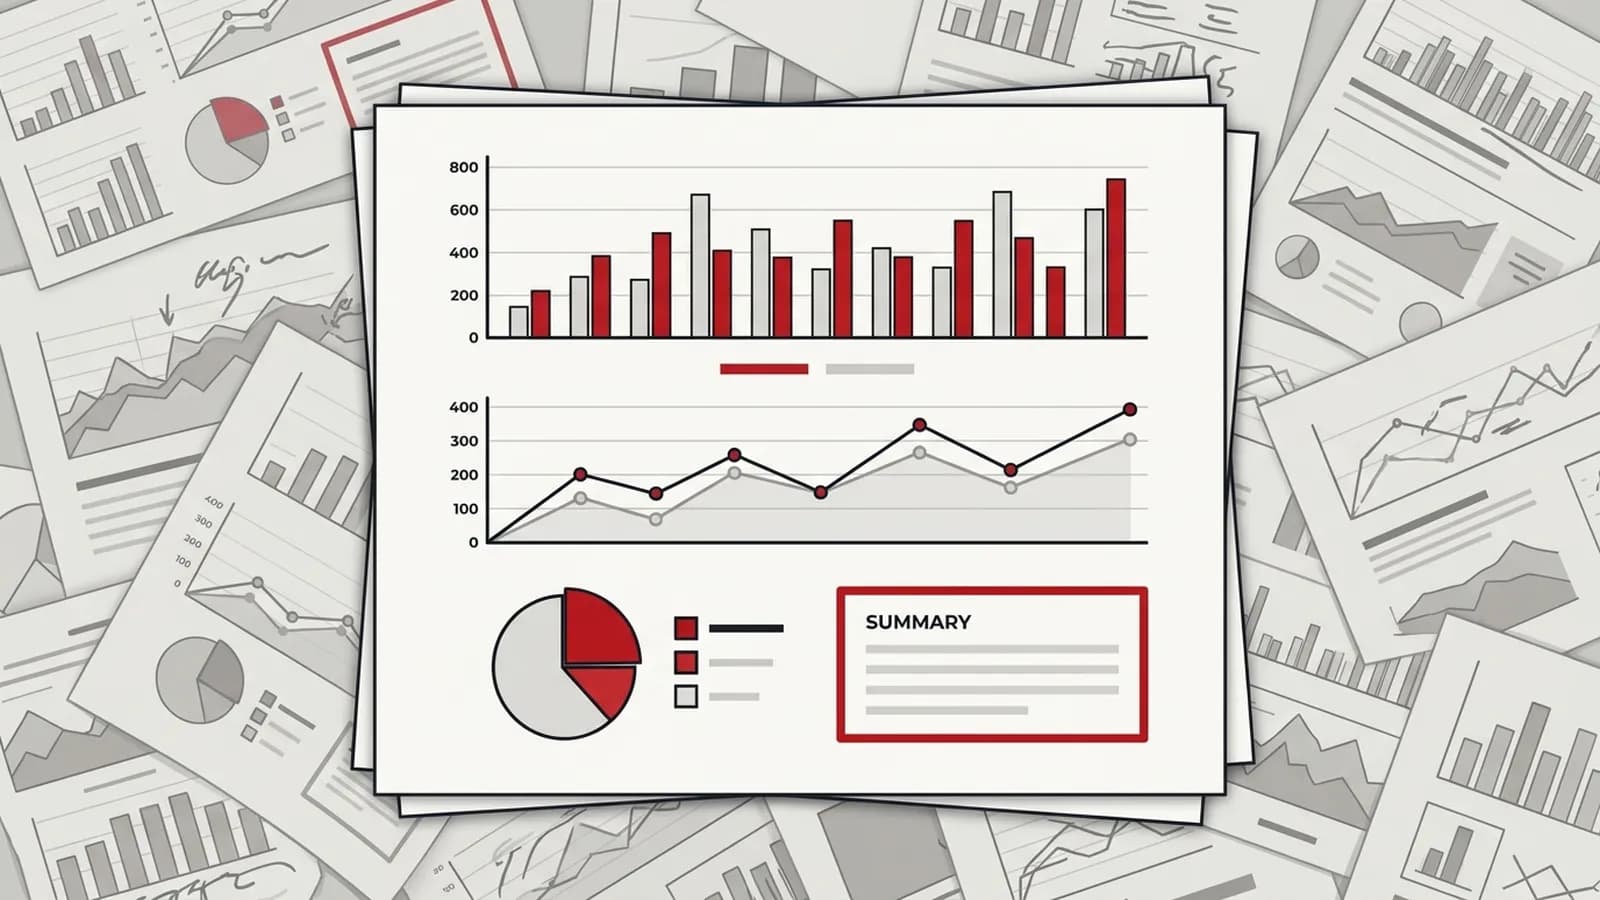
An SEO dashboard shows organic performance in one self-refreshing report. Build one in Looker Studio: GA4 and Search Console, layout, regex and filters.


Short answer
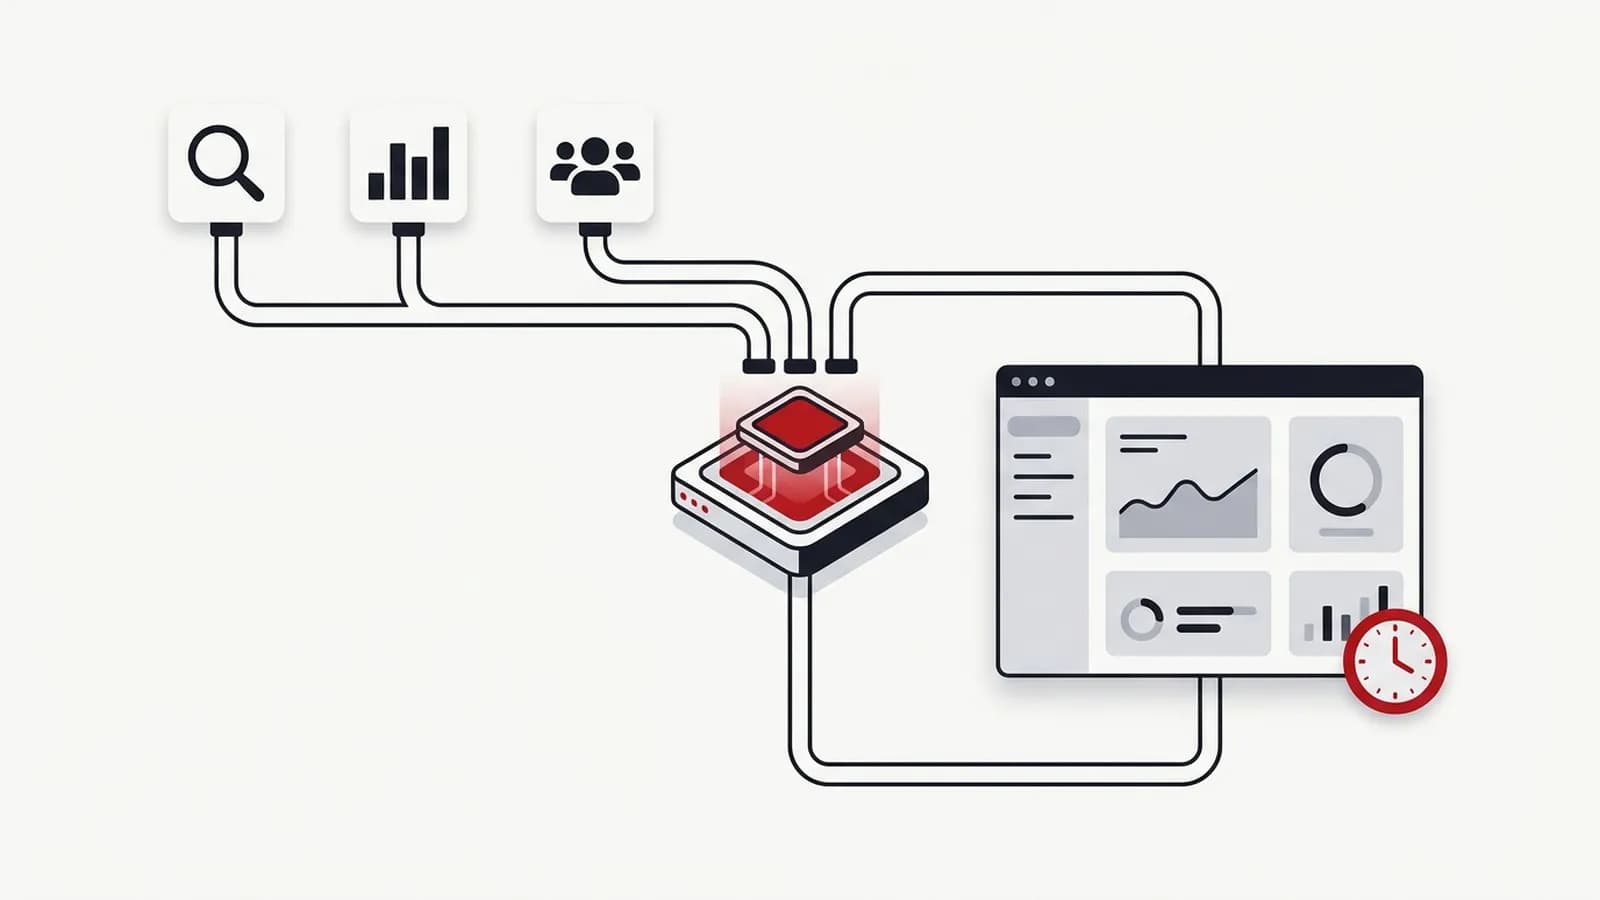
An SEO dashboard brings organic search performance into one report that refreshes itself. To build one in Looker Studio, connect Search Console (using the URL impression table for page and query analysis and the site impression table for totals) and GA4 with native connectors. Add pages for overview, queries, landing pages and conversions, create branded versus non-branded fields with regex, add date and device filters, then share and schedule it.
Key takeaways
- An SEO dashboard should answer a few fixed questions for a specific audience — executives, the SEO team or the content team — rather than show every available metric.
- Looker Studio is free and has native GA4 and Search Console connectors, so a useful SEO dashboard needs no paid tools.
- Use the Search Console site impression table for property-level totals and the URL impression table for page-level analysis — and do not mix them in one chart.
- A branded versus non-branded split using a REGEXP_MATCH calculated field is the most valuable single addition to an SEO dashboard.
- Search Console data typically lags by about two days, so end default date ranges a few days ago to avoid false drops.
- Move to BigQuery when you need more than 16 months of history, heavy joins, many properties or faster, quota-free performance.
In this article (12 sections)
- 1What is an SEO dashboard?
- 2What should a Looker Studio SEO dashboard answer?
- 3SEO dashboard examples by audience
- 4Step 1: Connect Search Console and GA4
- 5Step 2: Structure the dashboard into pages
- 6Step 3: Add calculated fields that make the data useful
- 7Step 4: Add filters and controls
- 8Step 5: Share and schedule the report
- 9Common mistakes that make dashboards wrong
- 10Adding rank tracker data: SE Ranking, Semrush and others
- 11Building a multi-client SEO dashboard for an agency
- 12When should you move to BigQuery?
An SEO dashboard built in Looker Studio (formerly Google Data Studio) is the simplest way to stop exporting Search Console and GA4 data by hand. Looker Studio is free, it has native connectors for both, and a well-built dashboard refreshes itself so stakeholders always see current numbers.
The problem is that most templates are either too thin to be useful or so crowded that nobody reads them. This guide walks through how I build a Google Looker Studio SEO report: the connectors, the pages, the calculated fields, the filters and the mistakes that make numbers wrong.
What is an SEO dashboard?
An SEO dashboard is a single report that shows how organic search is performing, using data pulled automatically from sources such as Google Search Console and GA4. A good one answers a few fixed questions — is organic search growing, which pages and queries are driving the change, and is it producing leads or revenue — and refreshes itself so nobody has to export data by hand.
What should a Looker Studio SEO dashboard answer?
Before adding a single chart, write down the questions the dashboard must answer. For most teams they are:
- Is organic search growing, and is that growth branded or non-branded?
- Which pages and queries are driving the change?
- Is organic traffic producing leads, sign-ups or revenue?
- What needs attention this week?
Every chart should map to one of these. If you are unsure which metrics matter for your audience, my SEO reporting guide covers what to report to leadership versus the delivery team.
SEO dashboard examples by audience
The same data serves different readers, so the pages and metrics should change with the audience.
Executive SEO dashboard
One page that can be read in under a minute:
- Non-branded organic clicks, compared with the previous year
- Organic leads, sign-ups or revenue from GA4
- Branded versus non-branded split
- A short written note on what changed and what happens next
SEO team dashboard
Several pages built for diagnosis:
- Query table with clicks, impressions, CTR and average position
- Landing pages and page groups, with top gaining and declining pages
- Position bands (top 3, 4–10, 11–20, beyond)
- Technical watchlist with device and country splits
Content team dashboard
Focused on the articles and pages the team owns:
- Performance by content page group, such as blog or guides
- Queries each article ranks for, with clicks and impressions
- Engagement and key events by article from GA4
- Articles with falling impressions that may need a refresh
Step 1: Connect Search Console and GA4
Create a new report and add data sources using the native connectors.
Search Console. When you add the connector, Looker Studio asks you to choose a table. This choice matters more than anything else in the build.
| Table | What it aggregates by | Use it for |
|---|---|---|
| Site impression | The whole property | Headline totals, overall clicks, impressions, CTR and average position trends |
| URL impression | Each landing page | Page-level analysis, query-by-page tables, page groups |
Totals differ between the two tables because Google counts impressions differently at site and URL level. Add both as separate data sources, name them clearly (for example "GSC – Site" and "GSC – URL") and never compare numbers across them in one chart.
GA4. Add the GA4 connector for the same property. You will use it for sessions, engaged sessions and key events from organic search, filtered to the organic search channel group.
Step 2: Structure the dashboard into pages
Keep each page focused on one question. This is the structure I use as a GSC Looker Studio dashboard starting point:
| Page | Data source | Key elements |
|---|---|---|
| Overview | GSC – Site, GA4 | Scorecards with comparison period, clicks and impressions trend, branded vs non-branded split |
| Queries | GSC – Site | Query table with clicks, impressions, CTR, position; branded filter |
| Landing pages | GSC – URL | Page table, page-group breakdown, top gaining and declining pages |
| Conversions | GA4 | Organic sessions, engagement, key events by landing page |
| Technical watchlist | GSC – URL | Pages with falling impressions, device and country splits |
Five pages is usually enough. If a page is not viewed or acted on for a few months, remove it.
On each page, put scorecards with comparisons at the top, a trend chart in the middle and a detailed table at the bottom. Viewers read top to bottom, so the answer should come before the detail.
Step 3: Add calculated fields that make the data useful
Native fields show what happened. Calculated fields show what it means.
Branded vs non-branded queries
Create a field on the Search Console source such as:
CASE WHEN REGEXP_MATCH(Query, "(?i).*(yourbrand|your brand|yourbrnd).*") THEN "Branded" ELSE "Non-branded" END
Include common misspellings and product names. Branded growth usually reflects awareness or campaigns; non-branded growth is the clearest signal of SEO progress. Note that anonymised queries are not included in query-level data, so query totals will not match property totals.
CTR and position bands
Create an aggregated field that labels CTR as low, medium or high against thresholds you choose, and a similar field for position bands (top 3, 4–10, 11–20, beyond). Because these use aggregated metrics, they work in tables grouped by query or page but not as breakdown dimensions. For true bucketing at row level, do it in BigQuery.
Page groups
Use CASE with REGEXP_MATCH on Landing Page to group URLs into sections such as blog, product, services and location pages. Section-level trends are far easier to act on than a list of hundreds of URLs.
Step 4: Add filters and controls
- Date range control with a comparison period (previous period or previous year)
- Branded filter using your calculated field
- Device and country controls for Search Console pages
- Page group control on the landing pages view
Set a sensible default date range and apply controls at page level so viewers do not accidentally filter the whole report.
Step 5: Share and schedule the report
Share viewer access with stakeholders rather than edit access. Decide whether each data source uses the owner's credentials (viewers see data without their own access) or viewer's credentials (each viewer needs access to the property).
Use Looker Studio's scheduled email delivery to send a PDF or link on a fixed day. A scheduled report is a reminder, not a replacement for commentary; add a short written summary of what changed and what you will do about it. My guide to marketing reporting automation covers how to draft that summary automatically and keep a human in the loop.
Common mistakes that make dashboards wrong
When I review an existing Looker Studio SEO dashboard, the problems are rarely missing charts. They are numbers that are quietly wrong, which is worse than no dashboard at all.
- Ignoring the data lag. Search Console data typically arrives about two days late. A date range ending yesterday shows a false drop.
- Mismatched date ranges and time zones. Search Console reports dates in Pacific Time while GA4 uses your property's time zone, so daily numbers will not line up exactly.
- Mixing site and URL impression data in one chart, producing totals that do not match Search Console.
- Expecting GSC clicks to equal GA4 sessions. They measure different things and will never match.
- Sampling, thresholds and quotas. GA4 can apply data thresholds, and the connector has API quotas; many heavy charts on one page can trigger errors or slow loads.
- Too many charts. A dashboard nobody reads is not automation, it is decoration.
Adding rank tracker data: SE Ranking, Semrush and others
Search Console shows average position, but most teams also want tracked keyword rankings from a rank tracker. There are three ways to bring that data in:
- An official Looker Studio connector. Some tools, including SE Ranking and Semrush, publish their own connectors. Check which reports each connector exposes and whether it needs a particular plan.
- The tool's API into Sheets or BigQuery. Pull rankings on a schedule into your storage layer, then connect Looker Studio to that. This also keeps a ranking history you control. API access is often limited to higher plans, so confirm it first.
- Scheduled exports. A last resort: export to Google Drive or email on a schedule and load the file. It works, but it breaks more easily.
Keep rank tracker data on its own page or chart. Tracked rankings and Search Console average position measure different things and should not be mixed in one metric.
Building a multi-client SEO dashboard for an agency
An SEO agency manager needs two views: each client's own dashboard, and a portfolio view across every account.
- One template, many clients. Build the client dashboard once and connect each copy to that client's data, or point one dashboard at shared storage with a client filter. Changes to the template then roll out everywhere.
- A portfolio page for managers. With every client's data in the same Sheets or BigQuery tables, one page can list accounts by organic trend, conversions against target and reporting status, so the manager sees which accounts need attention first.
- Consistent definitions. Branded patterns, page groups and conversion events should follow the same naming for every client, otherwise the portfolio view compares unlike numbers.
My guide to automated SEO reports covers the client configuration sheet that makes this manageable at scale.
When should you move to BigQuery?
Native connectors are the right start, and for a single site a Looker Studio SEO dashboard on GA4 and Search Console alone can serve you for years. Move to BigQuery when:
- You need more than the 16 months of history Search Console keeps
- You want to join SEO data with CRM revenue from HubSpot or Salesforce
- You manage many properties or clients in one view
- Dashboards hit quotas or load slowly
- You need row-level bucketing, anonymised-query analysis or custom attribution
Search Console's bulk data export and the GA4 BigQuery export make this move straightforward, with Looker Studio staying as the front end. If you want this built properly, my SEO automation service covers dashboards and pipelines, and marketing operations support covers making sure someone owns and acts on the numbers.